SEO Statistics 2026: 200+ Facts Every Marketer Must Know
Search still drives discovery and revenue, but the odds are harsh: 96.55% of pages get no Google traffic at all. AI Overviews are cutting clicks where they appear, so rankings alone no longer explain performance — track citations, branded demand, and conversions alongside position.
Sahar
Content Writer
SEO statistics in 2026 show that search drives discovery, leads, and revenue. Most pages earn no traffic because weak targeting, technical problems, thin evidence, and low authority compound.
This report combines 200+ facts from research published between 2024 and July 2026.
Use Hoop’s SEO fundamentals guide for crawling, indexing, on-page work, authority, and business value.
What Do SEO Statistics Reveal About Search in 2026?
SEO statistics show that search remains a major discovery and revenue channel. AI answers reduce some clicks, but search demand remains enormous. You need stronger measurement, clearer content, and wider brand visibility.
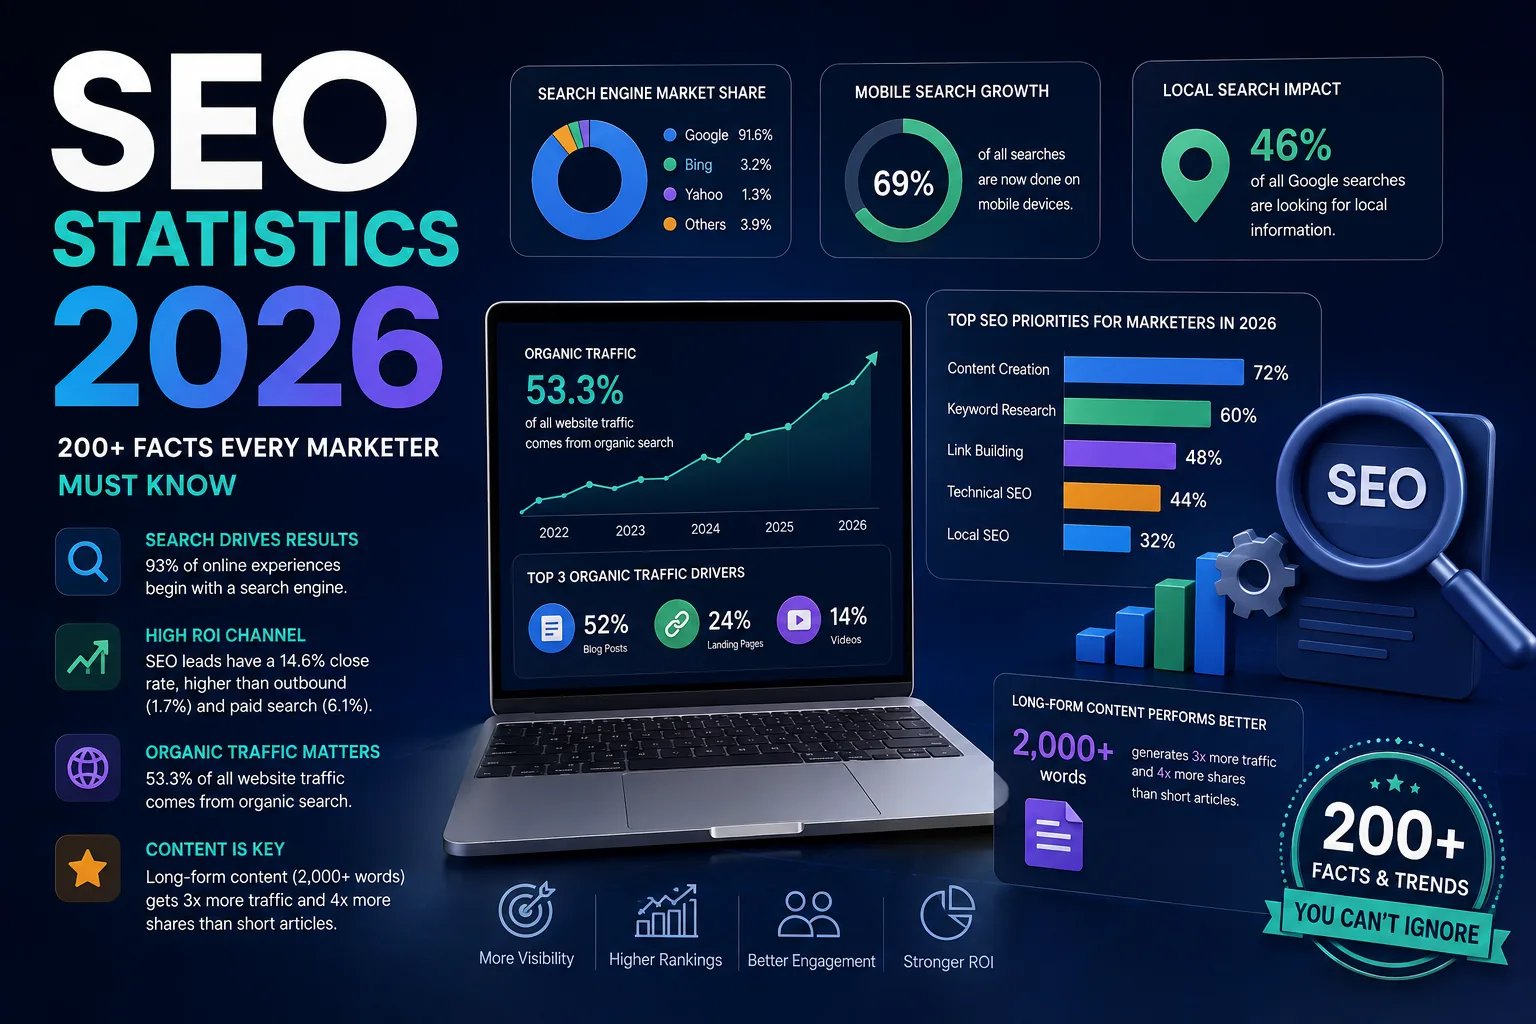
BrightEdge reports that 68% of online experiences begin with a search engine. SparkToro attributes 63.41% of United States web referrals to Google. BrightEdge also estimates SEO drives over 1,000% more traffic than organic social media.
Ahrefs finds that 96.55% of pages receive no Google search traffic. Only 1.94% receive between 1 and 10 monthly visits. Just 1.74% of new pages reach Google’s top 10 within one year.
SE Ranking reports that organic search supplies 46.98% of website traffic. That share declined 3.65% during 2025. Social platforms produce 10.12% of global referral traffic.
Forty-five percent use that channel most heavily. Among B2B marketers, 30.2% report the strongest return from websites, blogs, and SEO. Forty-nine percent call SEO their most effective digital strategy. Email follows at 24%, while social media follows at 13%.
These SEO statistics reject 2 common errors. Traffic alone cannot prove value. Rankings alone cannot explain lost clicks from answer-rich search pages. The Ahrefs SEO statistics report provides a useful source benchmark for page, traffic, and ranking comparisons.
How Large Is the Search Market in 2026?
SEO statistics confirm that Google still controls search demand. StatCounter measured Google at 91.31% worldwide during July 2026. Bing held 4.47%, while Yahoo held 1.24%. Yandex held 1.00% of worldwide search. DuckDuckGo held 0.65%, while Baidu held 0.50%.
Statista estimates that people run 5.9 million Google searches each minute. That pace equals roughly 8.5 billion daily searches. Google stores hundreds of billions of pages inside its index.
Google says the index exceeds 100 million gigabytes. Google also says 15% of daily queries have never appeared before.
SE Ranking classifies 70% of queries as informational. Commercial searches represent 22%. Navigational searches represent 7%, while transactional searches represent 1%.
SparkToro finds that the top 10,000 queries represent 46% of total demand. Just 148 terms contribute nearly 15%. Nearly 74% of keywords receive 10 or fewer monthly searches. Only 0.024% exceed 100,000 monthly searches.
Use Hoop’s SEO timeline guide to set realistic expectations around competition, authority, and growth.
How Are AI Answers Changing Organic Search?
SEO statistics now require AI-search context. Ahrefs associates AI Overviews with a 58% lower average click-through rate for the leading organic page.
Seer Interactive measured a 0.61% organic click-through rate for AI Overview queries during September 2025. The rate stood at 1.76% during June 2024. That change represents a 61% decline.
A 2026 academic study measured AI Overview activation across 55,393 queries. AI Overviews appeared for 13.7% of all tested queries. Question-form queries triggered AI Overviews 64.7% of the time. Another 2026 benchmark tested 11,500 representative queries and found AI Overviews on 51.5% of searches.
Nearly 30% of cited AI Overview domains did not appear on the same first results page. Eleven percent of tested claims lacked support from cited pages.
A separate causal study analyzed 161,382 article-language pairs. AI Overview exposure reduced English Wikipedia traffic by about 15%.
Google reports that AI search features now reach more than 2 billion users. Google still requires crawlable, indexable pages for inclusion. Read our AI search guide for a practical visibility framework across AI-driven results.
Track citations, branded demand, conversions, and assisted journeys beside rankings and clicks.
Which Ranking Positions Earn the Most Clicks?

SEO statistics still show a steep click advantage near the top. First Page Sage measures 39.8% click-through for position 1. Position 2 earns 18.7%. Position 3 earns 10.2%, while position 4 earns 7.4%.
The top 3 results collect 68.7% of organic clicks. The first page captures 96.6% of all Google clicks. The first result attracts 10 times more clicks than position 10. However, the top-ranking page earns the most total traffic only 49% of the time.
SparkToro reports that 61.5% of desktop searches end without a click. Mobile no-click searches reach 34.4%.
SE Ranking finds Related Searches on 85% of result pages. Review rich results appear on 79%.
Backlinko finds titles between 40 and 60 characters earn the strongest click-through rates. Keyword-related URL wording produces a 45% higher click-through rate. Ahrefs finds 7.4% of leading pages lack title tags.
Use Hoop’s on-page optimization guide to improve titles, headings, URLs, internal links, and answer structure. Average position needs query, device, feature, and page-level context.
What Do Content and Keyword SEO Statistics Show?
SEO statistics show that content success remains difficult. Ahrefs finds 72.9% of top-10 pages exceed 3 years old.
SE Ranking finds that 94% of webpages receive no Google traffic. Only 1% receive more than 10 monthly clicks. Ahrefs produces an even higher zero-traffic estimate of 96.55%.
Content investment continues growing. Siege Media reports that 11.3% of content marketers plan monthly budgets above $45,000. The share stood at 4.1% during 2024. Ahrefs reports that 87% of surveyed marketers use artificial intelligence during content creation.
HubSpot finds small businesses 23% more likely than average to report blog return. HubSpot also ranks website, blog, and SEO first for marketing return. Paid social follows at 26%. Conductor reports that 91% of digital marketers saw positive SEO effects on website performance and marketing goals.
High-converting page formats also differ. First Page Sage reports 4.6% conversion for white papers. Case studies reach 3.5%, while landing pages reach 3.1%.
Use Hoop’s content marketing guide when you need a complete research, publishing, and measurement workflow. Add original evidence, direct answers, named examples, and decision criteria competitors cannot copy quickly.
Which Technical SEO Statistics Matter Most?
Technical SEO statistics reveal widespread preventable problems. Chrome measured 18,257,384 origins during March 2026. Only 56.5% passed all Core Web Vitals.
Good Largest Contentful Paint reached 69.0% of origins. Good Cumulative Layout Shift reached 81.2%. Good Interaction to Next Paint reached 87.2%.
SE Ranking finds 23% of websites omit sitemap references from robots.txt. Seventeen percent place redirects inside sitemaps. Fifteen percent lack XML sitemaps completely.
Only 26% of audited websites use image alternative text. Thirty-six percent serve oversized images. Eighteen percent contain broken images.
Duplicate metadata remains common. Fifty percent of sites contain duplicate meta descriptions. Fifty-four percent repeat title tags across pages.
CSS creates additional waste. Fifty-eight percent of affected sites serve oversized CSS. Forty-nine percent leave CSS uncompressed, while 44% skip minification. Eighteen percent of affected sites disable useful CSS caching. Thirty-six percent contain 4XX pages. JavaScript appears on 98.9% of websites.
Use Hoop’s technical audit checklist to review 50 crawl, index, speed, structure, and schema signals.
What Do Backlink Statistics Reveal About Authority?
Backlink SEO statistics still show a strong authority relationship. Backlinko finds the leading result holds 3.8 times more backlinks than positions 2 through 10.
Around 95% of pages have no backlinks. SE Ranking finds 63% of backlinks point toward homepages. Only 37% reach deeper content and commercial pages.
SE Ranking classifies about 30% of backlinks as medium-risk or high-risk. Link quality therefore matters beside volume.
Content marketers also value earned links. About 40.7% call content marketing the strongest long-term passive link method. Among SEO professionals, 52.7% prioritize product and service pages for link acquisition.
uSERP reports 67.5% of respondents see a major ranking impact from links. Another 30% see a moderate impact. Only 2.5% see a low impact.
Quality leads link decisions for 35.9% of respondents. Quantity leads for 7.8%. Another 56.2% value quality and quantity equally. Forty percent of SEO professionals make backlinks their primary strategy priority, while 47.5% consider links equally important as content.
Review Hoop’s link building strategies before investing in outreach, digital public relations, or linkable assets. Google treats manipulative link schemes as spam.
Which Local and Mobile SEO Statistics Drive Action?
Local SEO statistics connect visibility with immediate action. SE Ranking classifies 14% of searches as local-information or business queries. Map results capture 42% of local clicks.
Google reports complete Business Profiles attract 70% more visits. Complete profiles also gain 50% more purchase consideration.
Google research finds 76% of local smartphone searchers visit a physical location within 24 hours. Twenty-eight percent complete a purchase.
WebFX reports 80% of local searches produce conversions. Seventy-nine percent of marketers call local optimization highly effective. Twenty-eight percent of specialists rank local work as their strongest tactic.
Monthly “near me” searches exceed 1.5 billion. Google controls almost 94% of mobile search. Mobile devices produce about 53% of global search traffic.
Sixty-one percent of users prefer purchasing from mobile-friendly websites. Fifty-one percent discover new companies or products through smartphone searches. AI Overviews and featured snippets can occupy 75% of a mobile screen. Local rankings also rely on relevance, distance, and prominence.
Use Hoop’s local SEO checklist to improve profiles, reviews, citations, local pages, and conversion tracking. Measure calls, directions, bookings, visits, leads, and revenue beside map rankings.
How Do Social Platforms Affect Search Visibility?
SEO statistics increasingly include social platforms. SE Ranking finds at least 1 social platform in 50% of Google top-10 result sets.
Reddit appears in 37% of those searches. YouTube appears in 19.8%. Quora appears in 8%, while LinkedIn appears in 5%. Instagram appears in 2.6% of search sets containing social results.
Social content also appears in 20% of AI Overviews. The share reaches 36% inside AI Mode. SE Ranking finds social platforms inside 53.89% of ChatGPT responses. Reddit, LinkedIn, Medium, and YouTube receive the most frequent mentions.
Facebook produces 76.56% of social referral traffic. Instagram contributes 6.72%, while TikTok contributes 5.50%. LinkedIn contributes 2.97%. Pinterest contributes 2.61%. Those 5 platforms generate almost 95% of social referrals. TikTok’s referral traffic grew fivefold during 2025.
TikTok records a 1.73% median engagement rate. Instagram records 0.36%. Facebook records 0.04%, while X records 0.015%.
Social visibility supports branded demand, first-person evidence, video discovery, reviews, and validation. Coordinate websites, video, communities, public relations, and customer proof. Social engagement is not a direct Google ranking factor.
What Do SEO Budget and Career Statistics Show?

SEO statistics on pay and budgets show a maturing profession. Around 64.5% received a recent pay increase. Forty percent name algorithm changes as their largest SEO challenge.
SEO heads average $75,000, while business owners average $130,000. Managers earn 41.5% more than non-management specialists.
Freelancers earn a $58,000 median, compared with $50,675 for employed specialists. Junior salaries average $33,640, while senior salaries average $60,160.
Typical specialist rates range from $100 to $150 hourly. The United States average salary reaches $70,300, while the global median reaches $51,680.
AIOSEO reports 74% of small businesses invest in SEO. Average monthly spending reaches $497, while common retainers range from $500 to $1,000.
SEO industry statistics show sustained demand. Research and Markets valued the market at $82.3 billion in 2023 and forecasts $143.9 billion by 2030.
How Should You Measure SEO Performance?
To measure SEO performance, start with business outcomes. SEO statistics need context from competition, site age, intent, and conversion quality.
Many strategies need about 3 months before meaningful directional evidence appears. Strong traffic and lead growth often need 6 to 12 months.
Google Search Console provides 4 core search measures: impressions, clicks, click-through rate, and average position. Google Analytics 4 adds organic sessions, engaged sessions, conversions, and revenue. Customer relationship management data adds qualified leads, pipeline, and closed sales.
A healthy new site gains indexed pages, relevant impressions, non-branded queries, and clicks across more pages. Authority grows through links, mentions, customer evidence, and useful content.
Rising impressions without clicks can signal weak titles, low positions, or answer-rich results. Clicks without conversions can signal intent mismatch.
Separate branded, non-branded, local, informational, commercial, and transactional demand. Each group supports different outcomes. Use the quick-reference table below to turn SEO statistics into an operating dashboard.
Quick-Reference SEO Measurement Table
| Task | Timing | Method | Difficulty |
|---|---|---|---|
| Check index coverage | Weekly | Search Console pages report | Easy |
| Review query movement | Weekly | Compare clicks, impressions, and positions | Medium |
| Inspect technical health | Monthly | Crawl site and test Core Web Vitals | Medium |
| Evaluate content groups | Monthly | Compare clusters by intent and conversions | Medium |
| Connect leads to revenue | Monthly | Join analytics and customer records | Hard |
| Reprioritize roadmap | Every 90 days | Scale winners and fix limiting constraints | Medium |
Use one baseline for each page group. Compare progress against your own previous period before applying broad industry averages.
Which SEO Priorities Deserve Action in 2026?
SEO statistics point toward 6 priorities. Protect technical access, satisfy search intent, build distinctive evidence, earn authority, diversify visibility, and connect performance with revenue.
Start with crawlable pages and strong templates. Fix broken paths, duplicates, slow assets, and unclear canonicals.
Map queries to specific decisions. Informational pages resolve questions. Commercial pages compare choices. Transactional pages reduce friction.
Build information gain through data, examples, expert review, screenshots, calculations, and outcomes. Earn authority through useful assets and credible relationships. Avoid mass placements.
Publish consistent evidence across websites, video, publications, reviews, and relevant communities.
Review Hoop’s SEO agency guide when you need outside support for execution, reporting, and accountability. Connect visibility with conversions, qualified leads, acquisition cost, and lifetime value.
Turn SEO Statistics Into Measurable Growth
SEO statistics give you benchmarks, not guarantees.
Choose 3 constraints, set a 90-day baseline, and improve pages near qualified demand. Scale after conversions confirm progress.
Hoop Interactive connects search strategy, technical fixes, content, authority, analytics, and conversion tracking. Explore professional SEO services to build a search program tied to qualified traffic, leads, and revenue.
“96.55% of pages receive no Google traffic at all. Publishing is not a strategy — targeting, evidence, and authority are.”
Key takeaways
- 01Google holds 91.31% of worldwide search; roughly 8.5 billion searches run every day.
- 02Position 1 earns 39.8% click-through, and the top 3 results collect 68.7% of organic clicks.
- 03AI Overviews are linked to a 58% lower click-through rate for the leading organic page.
- 04Only 56.5% of 18.2 million measured origins pass all Core Web Vitals.
Written by
Sahar
Content Writer
Frequently Asked
Questions
Everything you need to know before booking a strategy call. Can't find your answer? Contact us directly.
Yes. Search remains a major discovery channel, while website, blog, and SEO lead reported marketing return.
96.55% of pages receive no Google traffic. It reframes SEO as a targeting and authority problem rather than a publishing-volume problem.
Most campaigns need 3 to 6 months for clear progress. Competitive programs often need 6 to 12 months.
Yes. Leading pages hold more backlinks, but relevance, editorial quality, and placement context matter more than raw volume.
Use benchmarks for direction, not promises. Compare every figure with your industry, market, baseline, and conversion goals.