Instagram Statistics: Users, Reach, Reels, and Benchmarks
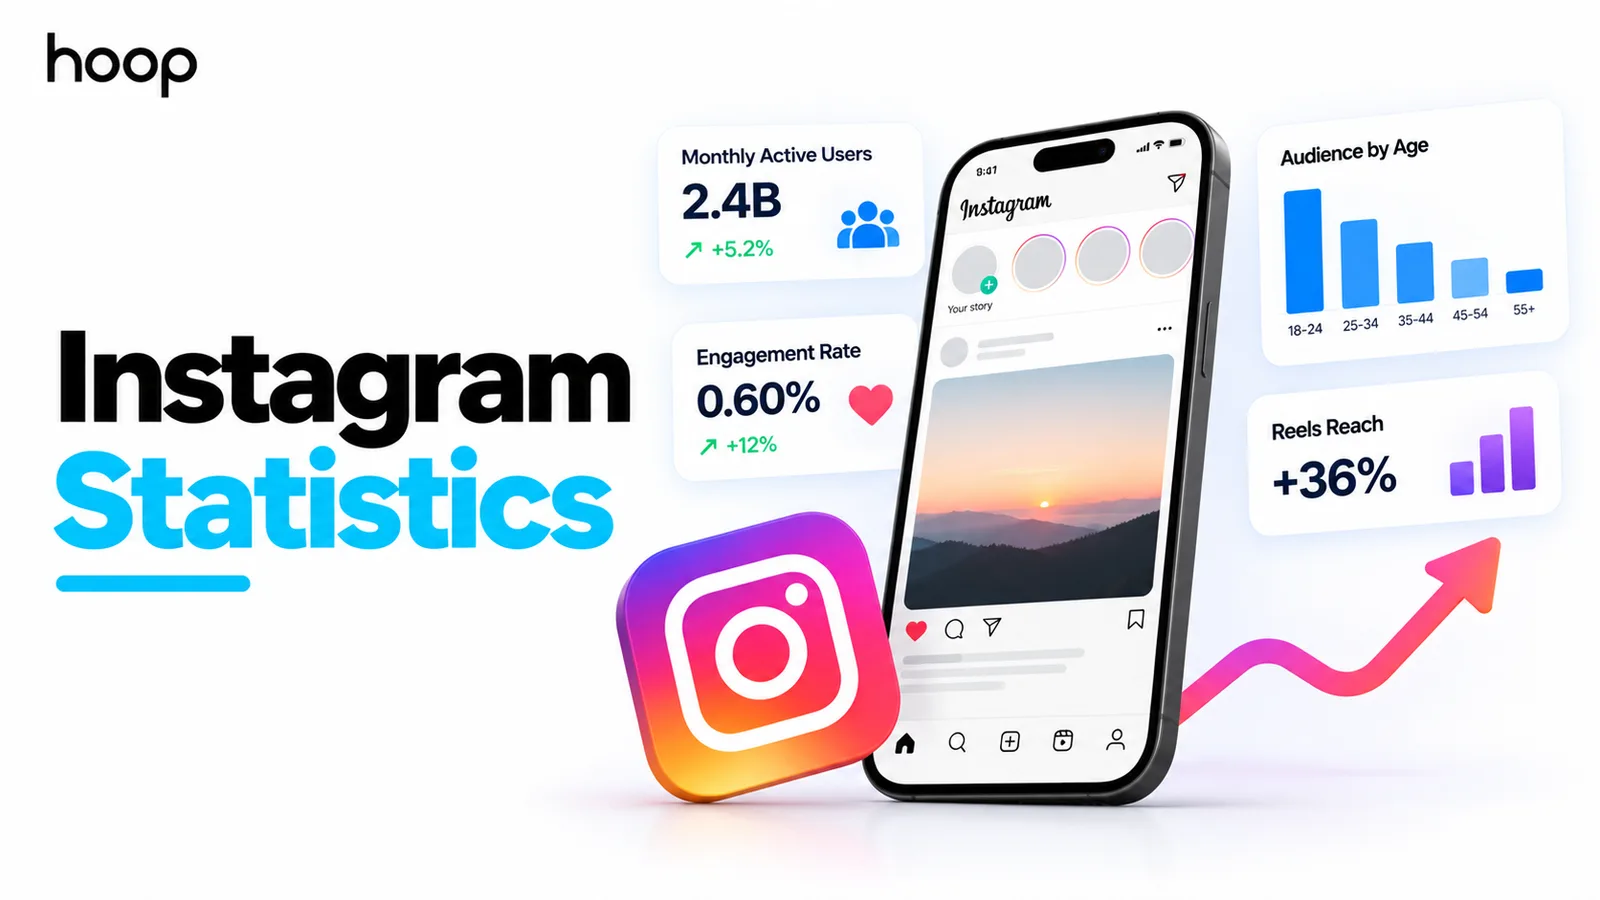
Instagram reached 3 billion monthly and 2 billion daily active users in 2026, with carousels leading average engagement at 0.50% and Reels driving discovery. Use platform benchmarks as context, then let your own account data set the targets.
Sahar
Content Writer
Instagram has 3 billion monthly active users and 2 billion daily active users in 2026. These Instagram statistics show a platform centered on Reels, messaging, discovery, and measurable business activity.
Meta confirmed the monthly figure in September 2025 and the daily figure in July 2026. People also reshare Reels 4.5 billion times daily across Meta platforms. Marketers should compare platform benchmarks with first-party account data before changing budgets or content plans.
What Do Instagram Statistics Show in 2026?
Instagram combines global scale with high daily use and expanding recommendation traffic. The latest Instagram statistics also show stronger competition for organic engagement.
Which Instagram numbers define the platform?
Instagram reached 3 billion monthly active users during 2025. Instagram reached 2 billion daily active users by July 2026.
Meta’s family of apps averaged 3.60 billion daily active people during June 2026. That family includes Facebook, Instagram, Messenger, and WhatsApp.
Instagram therefore reaches a large share of the global internet audience. Monthly active users and daily active users describe different participation levels.
Monthly active users open Instagram at least once during a measured month. Daily active users open Instagram during a measured day.
Marketers should never compare monthly users with advertising reach. Meta’s advertising tools estimate reachable accounts within selected locations, ages, and placements.
Which Instagram statistics deserve immediate attention?
The following Instagram statistics provide a useful starting point for 2026 planning:
- Track 3 billion monthly active users across the platform.
- Track 2 billion daily active users across the platform.
- Track 4.5 billion daily Reel reshares across Meta platforms.
- Track 50% Instagram usage among United States adults.
- Track 80% Instagram usage among United States adults aged 18 to 29.
- Track 0.48% average Instagram engagement across measured brand accounts.
- Track 0.50% carousel engagement during the second quarter of 2026.
- Track 0.48% Reels engagement during the second quarter of 2026.
- Track 0.33% single-image engagement during the second quarter of 2026.
- Track 75% original posts within United States Instagram recommendations.
Each benchmark uses a defined method and audience. Your account can perform above or below every platform average.
Who Uses Instagram in 2026?
Adults aged 18 to 34 form Instagram’s largest global audience group. Instagram demographics still vary across countries, income levels, and urban areas.
Which age groups use Instagram most?
The 25-to-34 age group forms Instagram’s largest global advertising audience. Adults aged 18 to 24 form the next-largest group.
DataReportal estimates that adults aged 18 to 34 represent about 62% of Instagram’s global advertising audience. Advertising audience estimates do not equal verified active users.
Pew Research Center found that 80% of United States adults aged 18 to 29 use Instagram. Usage falls to 19% among adults aged 65 and older.
Those Instagram statistics guide audience selection. A retirement service needs different platform priorities than a fashion retailer or fitness brand.
Which countries have the largest Instagram audiences?
India holds Instagram’s largest reported advertising audience. The United States ranks second, while Brazil ranks third.
DataReportal reported about 414 million Instagram users in India during its latest country comparison. The United States recorded about 172 million users.
Brazil recorded about 141 million users in the same comparison. Indonesia, Turkey, Japan, Mexico, and the United Kingdom followed those markets.
Instagram statistics by country describe potential advertising audiences. Location, language, purchasing power, and product availability determine commercial value.
How does United States Instagram usage differ?
Half of United States adults use Instagram. Women report higher adoption than men across the latest Pew survey.
Urban and suburban adults also report stronger adoption than rural adults. College graduates and higher-income adults show above-average usage.
These Instagram statistics support careful audience segmentation. Brands should still use Instagram Insights to validate actual follower demographics.
How Much Time and Attention Does Instagram Capture?
Instagram captures frequent daily attention through feeds, Reels, Stories, direct messages, and recommendations. Time spent grows when recommendations match personal interests.
Why do Reels and messages drive daily use?
Meta reports that messaging has become Instagram’s most popular photo and video sharing method. People reshare Reels 4.5 billion times daily across Meta platforms.
Reels support discovery beyond existing followers. Direct messages support private sharing, customer questions, and repeated conversations.
Instagram also reached 2 billion daily active users during July 2026. Daily activity gives brands repeated opportunities to earn attention.
High daily use does not guarantee high brand visibility. Instagram ranks each piece of content through personalized recommendation systems.
What does recommendation traffic mean for marketers?
Instagram statistics show recommendation traffic reaching people beyond existing followers. Explore, Feed recommendations, and Reels surfaces create that distribution.
Meta reported that original posts supplied 75% of United States Instagram recommendations during late 2025. Original content gained 10 percentage points during one quarter.
Brands should publish original education, demonstrations, commentary, entertainment, and customer evidence. Reposted material receives weaker recommendation eligibility without added value.
A focused Instagram marketing strategy should connect recommended reach with profile visits, website clicks, leads, and sales.
Which Instagram Content Formats Produce the Best Results?
Carousels lead average engagement, while Reels drive comments, shares, and non-follower discovery. Single images produce the lowest current engagement benchmark.
How do Reels, carousels, and images compare?
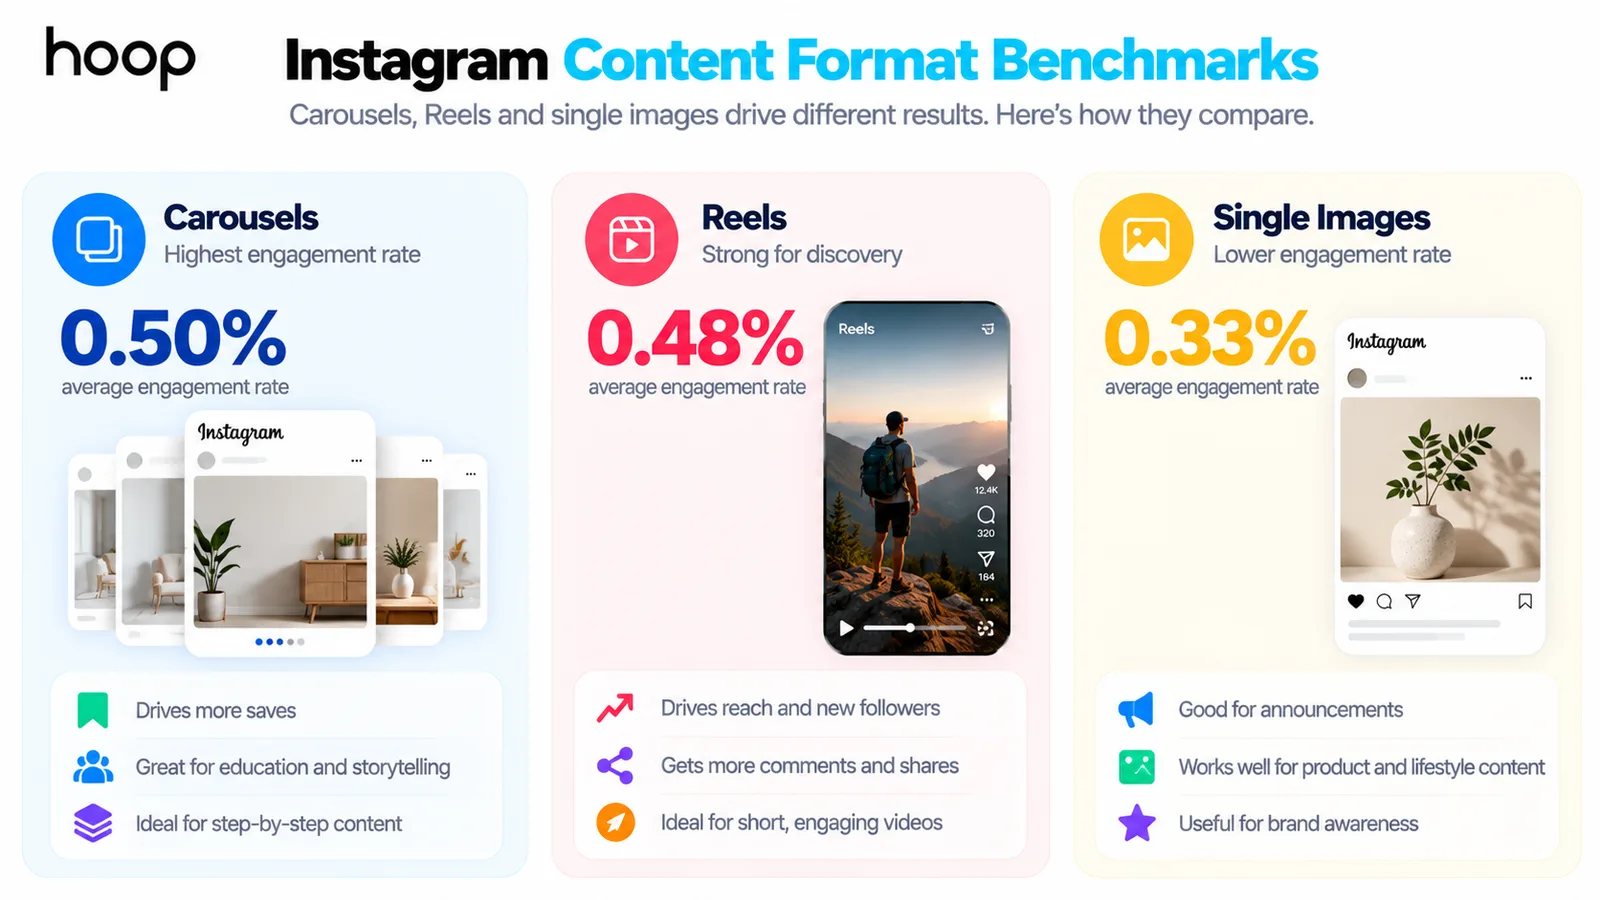
Socialinsider measured a 0.48% average Instagram engagement rate during the second quarter of 2026. The study reviewed millions of brand posts.
Carousels produced a 0.50% engagement rate. Reels produced a 0.48% rate, while single images produced a 0.33% rate.
Carousels generate saves because users retain educational slides, checklists, examples, and instructions. Reels generate comments and shares through movement, sound, and narrative pacing.
Single images still support announcements, product photography, testimonials, and campaign visuals. The lower benchmark does not make every image ineffective.
Which metric should you use for Reels?
Instagram statistics for Reels should include watch time, completion rate, shares, saves, profile visits, and follows generated. Views alone only measure counted plays.
A Reel can generate high views without attracting qualified followers. A broad trend can reach viewers outside your target market.
Compare the median performance across 10 to 20 Reels. The median reduces distortion from one viral Reel.
Track non-follower reach beside follower conversion. Strong discovery should produce relevant profile activity and repeat engagement.
Which metric should you use for carousels?
Use saves, shares, swipe completion, profile visits, and website actions. Carousels work well for structured education and decision support.
Examples include product comparisons, process breakdowns, mistake lists, case studies, and step sequences. Each slide should answer one clear question.
Compare save rate across similar topics. A high save rate signals future reference value, not immediate purchase intent.
Which Instagram Statistics Matter for Business Growth?
Business value comes from qualified actions, not raw follower counts. Instagram marketing statistics should connect attention with leads, sales, and customer value.
Which metrics match awareness goals?
Use reach, non-follower reach, impressions, video views, and branded search activity. Reach counts unique accounts, while impressions count total displays.
A large difference between impressions and reach can show repeat exposure. Repeated displays can also reflect paid delivery or multiple placements.
Separate organic reach from paid reach. Combined reporting hides the actual source of distribution.
Which metrics match consideration goals?
Use saves, shares, profile visits, direct messages, Story replies, and website clicks. Those actions show stronger intent than passive views.
A useful social media statistics guide can provide external benchmarks. Your own campaign history should control final targets.
Track topics, hooks, formats, calls to action, and audience segments. Those fields reveal which content patterns produce meaningful interest.
Which metrics match sales goals?
Use qualified direct messages, lead forms, booked calls, purchases, revenue, and customer acquisition cost. Connect every conversion with a source.
Platform reporting can undercount or overcount conversions across devices and attribution windows. Website analytics and customer relationship management records improve validation.
Follower growth cannot prove revenue. A smaller qualified audience can produce more sales than a broad inactive audience.
How to Read Instagram Statistics Without Misreading Performance
To read Instagram statistics without misreading performance, compare equal formats, goals, audiences, and time periods. One isolated number cannot explain account health.
What is the difference between reach and impressions?
Reach counts unique accounts that saw content. Impressions count every recorded display, including repeated displays to the same account.
Compare both metrics together. High impressions with stable reach can show repeat exposure.
High reach with weak profile activity can show broad but low-intent distribution. Strong reach should also support the campaign’s selected next action.
Why do Instagram statistics sometimes look inconsistent?
Instagram updates some metrics at different times. Organic, boosted, and advertising dashboards can also group results differently.
Views, plays, accounts reached, and impressions use different definitions. A single person can create multiple views but one reached account.
Date filters can exclude late activity. Deleted posts, collaborative posts, and shared placements can also change visible totals.
Record reporting dates and metric definitions. Export monthly data before interface changes affect comparisons.
How can one viral Reel distort account averages?
A viral Reel can increase monthly reach without improving follower quality. Trend-driven viewers can leave after one interaction.
Calculate both mean and median results. The mean includes every value, while the median shows the middle result.
Compare follower conversion from the viral Reel with normal posts. Also compare saves, shares, profile visits, and repeat engagement.
A viral Reel supports growth when the topic matches the account’s regular promise. Unrelated virality attracts weaker long-term interest.
Can You Check Another Account’s Instagram Analytics?
You cannot access another account’s private Instagram Insights without permission. You can review public posts, followers, visible engagement, and estimated growth trends.
What can public analytics tools show?
Tools such as Social Blade can show follower changes, posting activity, and public engagement estimates. Those tools cannot access private reach or retention.
Public Instagram statistics tools cannot verify audience locations, age groups, website clicks, conversions, or paid campaign results. Estimated engagement can differ from native data.
Use public tools for directional competitor research. Never present estimated metrics as verified account analytics.
Which tools should beginners use first?
Start with Instagram Insights and Meta Business Suite. Both tools show account-level data for professional accounts.
Instagram Insights reports reach, engagement, audience activity, content results, and follower changes. Meta Business Suite supports broader reporting and content management.
Beginners should review 30 to 50 posts before buying another analytics platform. Larger samples reveal stronger patterns across timing, topics, audio, and formats.
Paid tools add competitor comparisons, exports, dashboards, and team workflows. Tool value depends on reporting complexity and account volume.
Which statistics matter for brand deals?
Brands evaluate average Reel views, consistency, audience fit, saves, shares, comments, and previous campaign results. Native screenshots provide stronger evidence than public estimates.
Creators should report median Reel views beside the strongest Reel. Median results show repeatable performance without hiding exceptional outcomes.
Brands also review audience country, age, gender, and content suitability. A relevant audience creates more value than a larger mismatched audience.
How to Turn Instagram Statistics Into a Monthly Plan
To turn Instagram statistics into a monthly plan, assign every metric to one business goal. A monthly review should produce specific content and budget decisions.
Which workflow keeps reporting useful?
Use the following workflow for a focused monthly review.
| Task | Timing | Method | Difficulty |
|---|---|---|---|
| Export account data | Monthly, 20 minutes | Instagram Insights and Meta Business Suite | Easy |
| Separate content formats | Monthly, 15 minutes | Group Reels, carousels, images, and Stories | Easy |
| Compare median results | Monthly, 30 minutes | Review reach, retention, saves, shares, and conversions | Medium |
| Identify 3 winning patterns | Monthly, 30 minutes | Compare topics, hooks, formats, and calls to action | Medium |
| Set next tests | Monthly, 25 minutes | Choose 2 content tests and 1 conversion test | Medium |
| Connect revenue | Monthly, 45 minutes | Match platform, website, customer, and sales records | Hard |
Which 8 fields belong in a monthly scorecard?
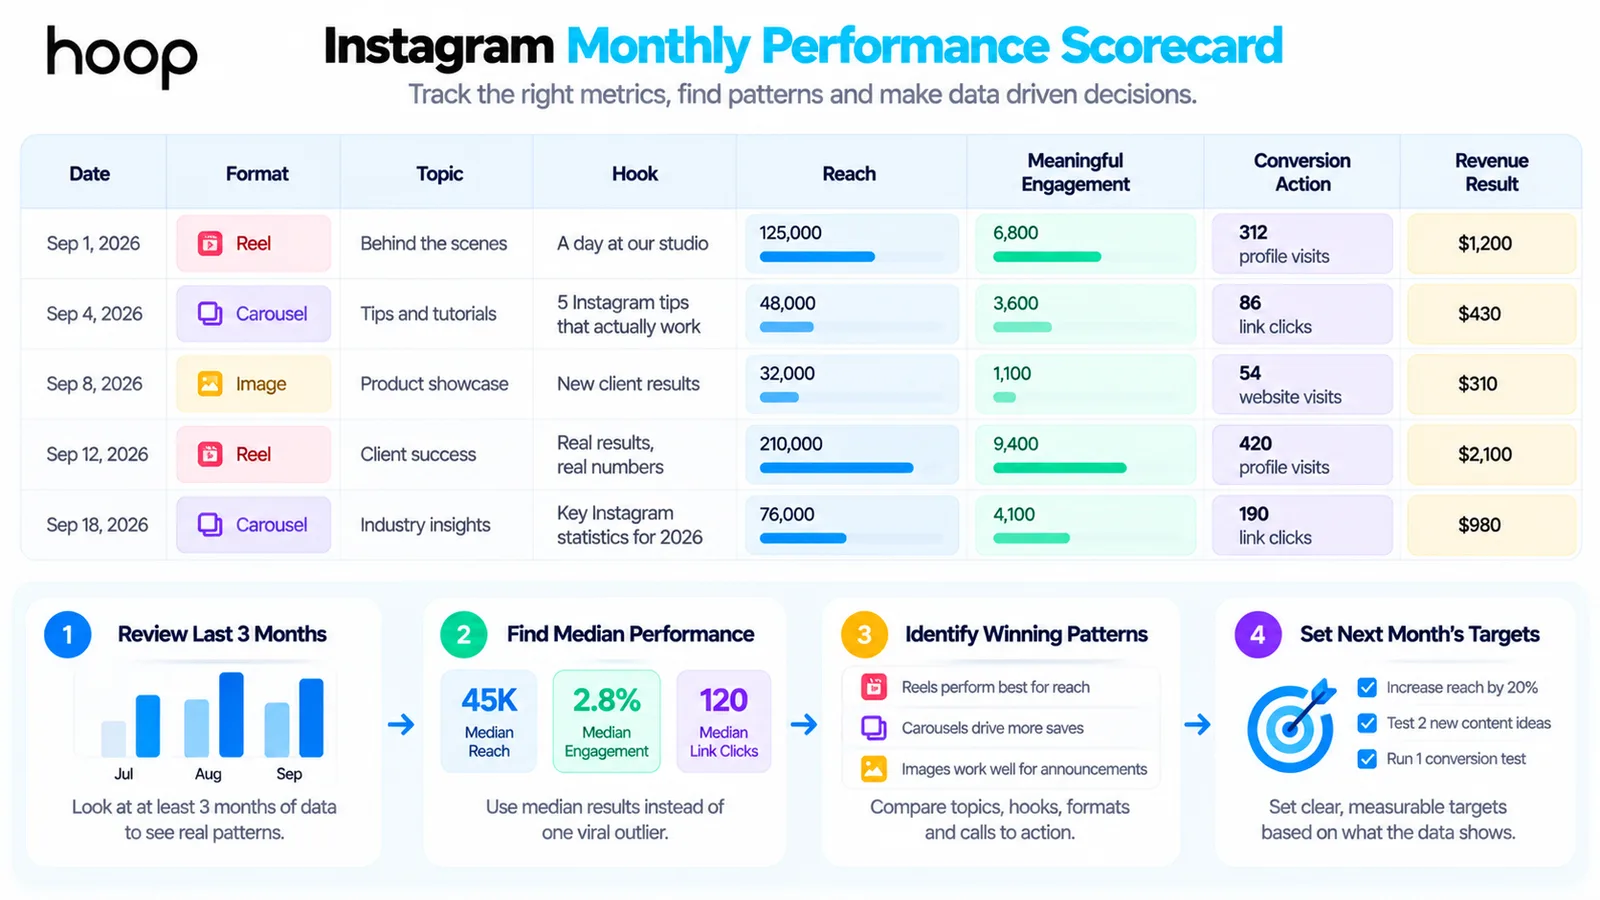
Track date, format, topic, hook, reach, meaningful engagement, conversion action, and revenue result. Keep every definition stable.
Meaningful engagement includes saves, shares, qualified comments, replies, and direct messages. Exclude passive likes when the campaign targets leads.
Conversion actions include profile visits, website clicks, forms, booked calls, purchases, and tracked messages. Select one primary conversion for each campaign.
How should you set the next month’s targets?
Set targets from the previous 3 months. Use median performance rather than one exceptional post.
Increase a target after repeated improvement across comparable content. Keep the same measurement method during every comparison.
Choose 2 creative tests and 1 conversion test. Examples include a new opening hook, carousel structure, and profile call to action.
Which Instagram Statistics Should You Track by Goal?
Track 5 to 8 metrics for each primary goal. Large dashboards create noise when every metric receives equal attention.
Which Instagram statistics support audience growth?
Track non-follower reach, profile visits, follows generated, follower conversion, shares, and repeat viewers. Those metrics connect discovery with audience growth.
Calculate follower conversion by dividing follows generated by profile visits. Compare the rate across similar Reels and carousels.
Which Instagram statistics support community growth?
Track comments, Story replies, direct messages, repeat commenters, saves, and shares. Community growth depends on repeated participation.
Count qualified comments separately from generic reactions. Product questions, personal experiences, and detailed responses show stronger engagement quality.
Which Instagram statistics support revenue?
Track website clicks, lead forms, booked calls, purchases, revenue, customer acquisition cost, and return on advertising spend.
Connect Instagram traffic with landing-page analytics. Add campaign tags to every external link when your tools support tracking.
Your Instagram statistics should influence decisions, not decorate reports. Remove any metric that never changes content, budget, or sales activity.
What Should You Do With Instagram Statistics?
Use Instagram statistics as external benchmarks, then let first-party results control decisions. Compare equal formats, track qualified actions, and review median performance monthly.
Build content around audience questions, original value, and measurable next steps. Connect reach with profile activity, leads, sales, and revenue.
Hoop Interactive’s social media marketing services connect strategy, content, paid campaigns, analytics, and reporting around defined business outcomes.
“Your Instagram statistics should influence decisions, not decorate reports. Remove any metric that never changes content, budget, or sales activity.”
Key takeaways
- 01Instagram reports 3 billion monthly and 2 billion daily active users; adults aged 18 to 34 are roughly 62% of the ad audience.
- 02Carousels average 0.50% engagement, Reels 0.48%, and single images 0.33% — each format serves a different goal.
- 03Reach counts unique accounts and impressions count displays; comparing the wrong pair is the most common reporting mistake.
- 04Use median rather than mean performance so one viral Reel does not distort your monthly targets.
Written by
Sahar
Content Writer
Frequently Asked
Questions
Everything you need to know before booking a strategy call. Can't find your answer? Contact us directly.
Yes. Meta confirmed 3 billion monthly active users in September 2025, and later reported 2 billion daily active users in July 2026.
Yes, for many established brand accounts. Socialinsider reported a 0.48% platform average for the second quarter of 2026. Compare similar account sizes and industries before judging your own rate.
No single format wins every goal. Reels drive discovery and shares, while carousels lead average engagement and saves.
No. Only authorized account users can access private reach, retention, demographics, clicks, and conversion data. Public tools provide estimates only.
No. High views can attract low-intent viewers who never follow, return, or purchase. Track profile visits and follower conversion beside views.
Keep reading
All articles →
How to Create a Social Media Marketing Campaign That Gets Results
Sep 27, 2026 · 10 min read
Social Media Marketing Plan: How to Build One Your Team Can Run
Sep 26, 2026 · 10 min read