Digital Marketing Statistics 2026: 500+ Facts and Trends
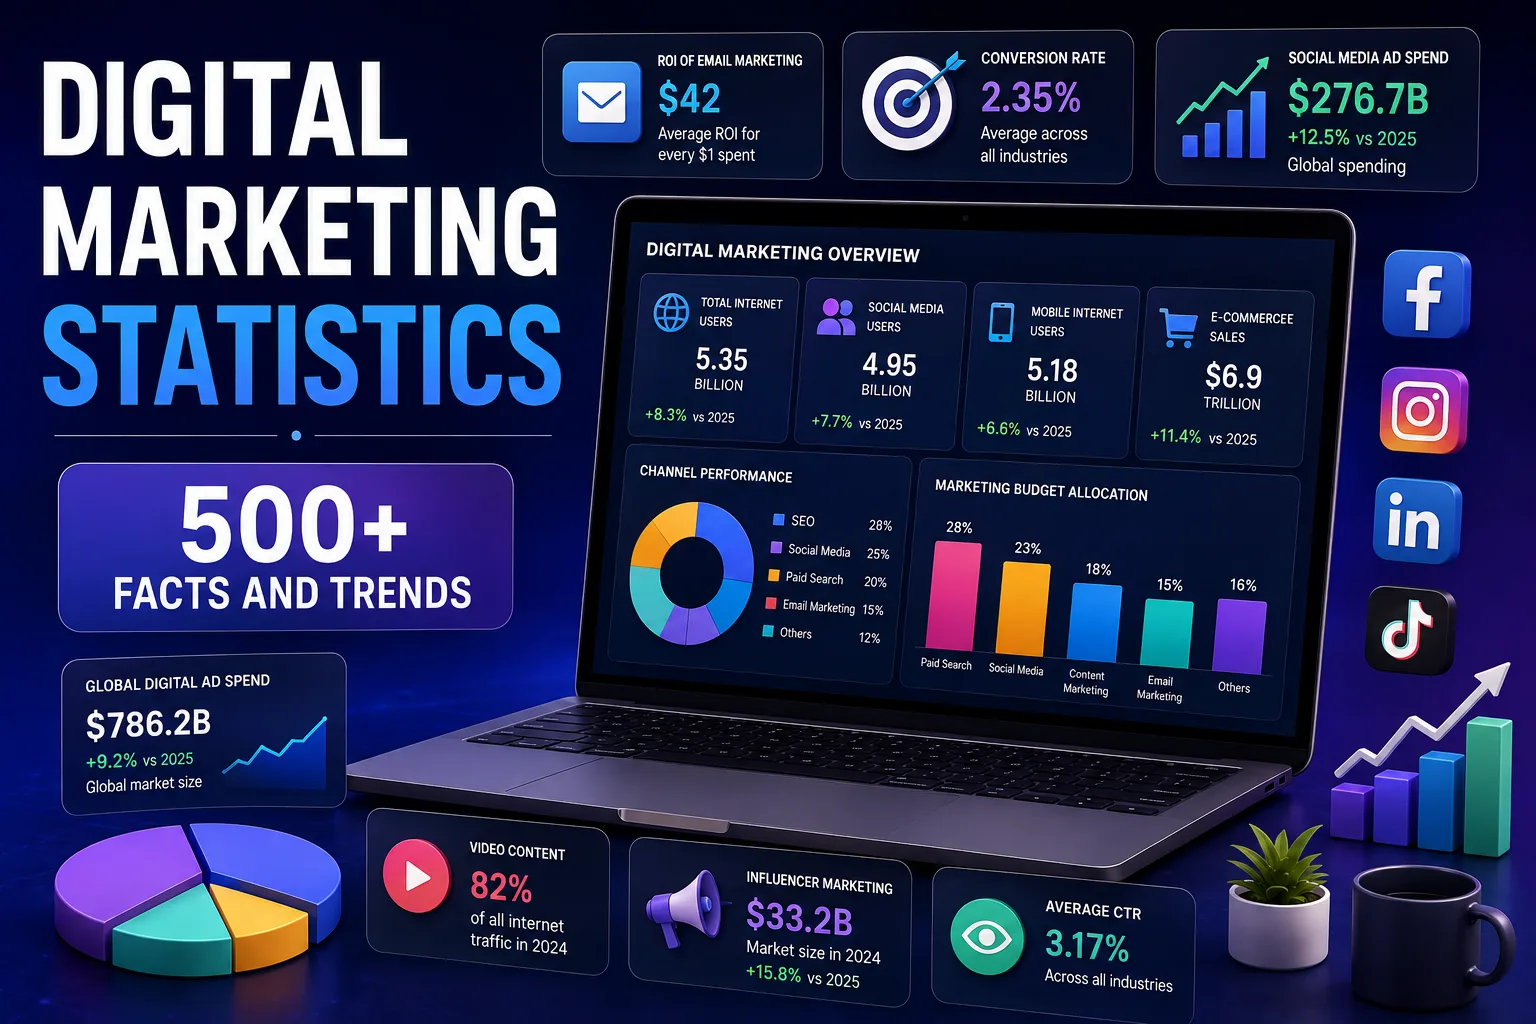
The 2026 data favours profitable attention over maximum activity. AI is now normal in marketing operations but confidence in measuring it sits below 48%. Video leads planned investment, email holds its value, and financial accountability — not reach — decides where budget goes.
Sahar
Content Writer
Digital marketing statistics in 2026 show a market shaped by AI, fragmented discovery, video, measurement, and trust. You should invest in channels that create qualified demand. Connect every campaign to revenue, retention, or customer value.
This report condenses more than 500 published facts, benchmarks, and trend signals into the findings that affect real marketing decisions. The focus stays practical. You will see where audiences spend attention, what marketers fund, and which numbers should change decisions.
What Do Digital Marketing Statistics Reveal About 2026?
The clearest pattern favors profitable attention over maximum activity. Marketers still use search, social, email, video, and advertising. However, teams now demand stronger proof before increasing budgets.
The latest digital marketing statistics also show a widening gap between adoption and execution. Many teams use artificial intelligence, automation, and customer data platforms. Fewer teams measure those systems confidently or connect them across departments.
That gap creates the central marketing challenge for 2026. You need faster production without generic output. You need broader visibility without spreading resources across every platform. You also need better attribution without pretending one dashboard explains every customer decision.
Current digital marketing statistics support 6 conclusions. Audiences still grow. Social remains commercially important. AI has entered normal operations. Video leads planned investment. Email retains value. Financial accountability shapes channel choices.
How Large Is the Digital Audience in 2026?
More than 6 billion people now use the internet, creating the largest recorded online audience. The Digital 2026 Global Overview Report estimates more than 1 billion monthly generative AI users.
Social media growth has slowed from its earliest years, but growth has not stopped. Global social identities increased by nearly 3.4 billion during the previous decade. Recent estimates place monthly growth near 20.5 million to 21.5 million identities.
Social advertising ranks as the third-largest global source of brand awareness after search engines and television advertising.
These digital marketing statistics reject the idea that one channel replaced every other channel. Customers discover brands through search, social, creators, email, marketplaces, reviews, video, and AI interfaces. Your strategy needs connected coverage across high-value stages.
A strong full-funnel marketing strategy connects discovery, consideration, conversion, retention, and measurement.
Which Marketing Metrics Matter Most in 2026?
Lead quality ranks above raw traffic because marketers must prove revenue impact. HubSpot reports that 39% prioritize lead quality and marketing-qualified leads. Another 34% prioritize lead-to-customer conversion rates.
Return on investment ranks at 31%, while customer acquisition cost ranks at 30%. Lead volume follows at 29%. Those priorities show why impressions, followers, and clicks cannot stand alone.
Digital marketing statistics should guide decisions through 4 levels. Attention shows notice. Engagement shows interaction. Conversion shows action. Financial metrics show sustainable value.
Use the following table to connect each channel with a decision-ready metric.
| Channel or task | Primary decision | Core metric | Review timing | Difficulty |
|---|---|---|---|---|
| Organic search | Expand or improve topic coverage | Qualified organic conversions | Monthly | Medium |
| Paid search | Increase, hold, or reduce spend | Cost per qualified lead | Weekly | Medium |
| Social media | Continue a format or creative angle | Saves, shares, and assisted leads | Weekly | Medium |
| Short-form video | Extend or replace an opening format | 3-second hold and completion rate | Per campaign | Medium |
| Email marketing | Improve segmentation or messaging | Revenue per recipient | Per send | Low |
| Landing pages | Keep or replace a page variation | Conversion rate | After enough traffic | Medium |
| AI workflows | Scale or stop an automation | Time saved plus verified output quality | Monthly | High |
| Retention | Increase customer investment | Repeat purchase rate and lifetime value | Quarterly | High |
How Is Artificial Intelligence Changing Marketing Performance?
Artificial intelligence now supports production, reporting, research, personalization, and media creation. Teams now ask whether AI works responsibly and profitably.
HubSpot’s 2026 marketing statistics show that 94% of marketers plan to use AI during content creation. About 80% already use AI for content, while 75% use AI for media production.
Automation has also moved beyond scheduled emails. About 93% of marketers report automation for administrative work, including scheduling, notes, and documentation. About 92% use automation for data analysis and reporting.
Confidence remains much lower than usage. Only 47.18% of marketers report confidence about incorporating AI into strategy. Only 47.63% report confidence about measuring AI’s marketing impact.
Adobe’s 2026 research adds context. About 76% report faster or higher content production. Another 69% report productivity gains, while 65% report improved marketing-driven revenue.
Those digital marketing statistics do not prove every AI workflow creates value. Strong results require accurate data, brand rules, human approval, and measurable goals. Weak teams automate output. Strong teams automate repetitive work while retaining judgment.
You should start with one expensive bottleneck, such as research synthesis, reporting, content repurposing, or campaign variation. Measure time, quality, error rates, and commercial outcomes before expanding the workflow.
What Do Search Marketing Statistics Mean for Visibility?

Search remains a high-intent channel, while users ask longer questions and use AI-assisted research. Customer journeys also include maps, videos, reviews, forums, and conversational systems.
DataReportal’s 2026 mid-year analysis found that Google represented 19.79% of traffic across the world’s top 10,000 domains. ChatGPT represented 1.32% during the same measured period.
Digital marketing statistics point to 3 search layers. Technical performance helps systems crawl and understand pages. Useful content answers complete questions. Authority signals help customers and platforms trust the answer.
Digital marketing statistics show why rankings alone provide an incomplete picture. Customers can see brands without visiting immediately. Branded searches, calls, direct visits, assisted conversions, and sales conversations reveal added value.
The safest search strategy builds original pages around customer needs rather than publishing repeated keyword variations. Strong editorial links still support authority, especially when research offers new evidence. Hoop’s link building strategies guide explains how digital public relations and useful assets earn relevant coverage.
Which Social Media Trends Still Produce Business Value?
Social media still creates awareness, research, trust, and paid distribution at global scale. More than 30% of adult internet users discover brands through social advertising.
Social advertising ranks as the leading brand-awareness source among people aged 16 to 34. That strength explains continued investment in Instagram, Facebook, TikTok, YouTube, LinkedIn, and creator partnerships.
HubSpot reports that 70% of marketers use Instagram, making Instagram the most-used social platform among surveyed marketers. Marketers also cite Instagram most often for social return on investment. Facebook reaches 69.6% marketer adoption, while 43% place Facebook among their strongest return channels.
About 26% of marketers plan to test direct social selling during 2026. Digital marketing statistics support focused platform selection. Choose platforms through audience behavior, content capability, sales cycle, and measurement quality. A consultancy needs a different mix than a fashion retailer.
Hoop’s social media marketing services connect content, paid distribution, community management, and revenue reporting. That structure prevents teams from treating posting volume as a growth strategy.
Why Does Video Keep Winning Marketing Investment?

Digital marketing statistics show that video wins investment across discovery, education, proof, entertainment, and demonstrations. HubSpot places short-form video first among planned content investments for 2026.
Live video, long-form video, user-generated content, and blog posts follow among the leading formats. That order shows that marketers value both fast discovery and deeper explanation.
Short-form video needs immediate attention. Adobe reports that 50% of customers give marketing 2 to 5 seconds. Clear outcomes, visible proof, specific problems, and early movement help creators use that window.
Digital marketing statistics cannot identify one perfect video length for every audience. Completion rates depend on topic, format, platform, audience familiarity, and customer intent. Your team should compare similar videos rather than mixing unrelated formats.
Repurposing also matters. About 48% of social marketers adapt similar content across multiple platforms. A strong interview can become a long video, short clips, an article, an email, and sales enablement material.
Are Content and Email Marketing Still Worth Funding?
Content and email remain valuable because both support owned visibility and repeated customer contact. Blogs remain among the 5 strongest planned content investments during 2026.
About 41% of marketers measure content success through sales, while traffic remains another common success metric. The combination shows why content teams need both discovery and conversion reporting.
Content earns value through specificity. Original research, detailed comparisons, customer questions, expert commentary, case evidence, and clear processes give buyers reasons to return. Generic summaries create little differentiation because AI can reproduce generic information quickly.
Digital marketing statistics also confirm email’s strategic value. About 75% of marketers plan to maintain or increase email investment during 2026. More than 70% of people across age groups use email monthly.
Segmentation improves performance. HubSpot reports 30% more opens and 50% more clicks for segmented campaigns than unsegmented campaigns. About 78% of marketers identify subscriber segmentation as their most effective email approach.
Basic personalization remains common, with 53% of marketers adding elements such as a recipient’s name. Strong personalization goes further by using lifecycle stage, previous behavior, purchase history, content interest, and service needs.
These digital marketing statistics support one principle. Convert rented attention into owned relationships with customer permission. Email lists, customer databases, loyalty programs, and communities reduce algorithm dependence.
What Do Paid Advertising Statistics Say About Budget Efficiency?
Paid advertising supports speed, testing, retargeting, and demand capture, while rising scrutiny rewards disciplined measurement. More than 75% plan to maintain or increase search and display investment during 2026.
Large platforms still command a major share of global budgets. EMARKETER projects that Meta, Google, and Amazon will control 62.3% of global digital advertising revenue during 2026. Platform concentration gives advertisers broad reach, but concentration also increases dependence on automated systems.
Digital marketing statistics show automation can improve bidding, placement, and creative testing. Automation can also hide weak offers, bad landing pages, or incorrect conversion tracking. Marketers should separate platform-reported results from verified business outcomes.
Use cost per qualified lead, customer acquisition cost, contribution margin, and payback period for budget decisions. Return on ad spend cannot show profitability when the calculation ignores fulfillment, returns, sales labor, or repeat purchases.
A useful Google Ads cost guide can help you compare budget levels, campaign types, and common cost drivers. Your actual benchmark should still come from your market, offer, conversion path, and customer economics.
Digital marketing statistics also explain why landing-page performance deserves equal attention. More traffic magnifies weak conversion rates. Better message alignment, faster pages, stronger proof, and clearer forms can improve results without increasing media spend.
Why Are Trust and Creator Marketing Growing Together?
Trust shapes distribution because customers verify claims through creators, reviews, communities, and public discussions. Audiences compare polished advertising with customer experiences before contact.
Digital marketing statistics explain why creator marketing responds to that behavior. Smaller creators often serve focused communities with recognizable interests and stronger interaction. Large follower counts still support reach, but audience fit and credibility influence commercial value.
User-generated content also attracts investment because creator-style material can show products in natural contexts. Strong campaigns use clear disclosure, accurate claims, brand safeguards, and creator freedom within defined boundaries.
Digital marketing trends favor founder-led and employee-led content. Named expertise, original opinions, demonstrations, and customer evidence build more trust than anonymous summaries.
You should measure creator programs through qualified visits, code usage, assisted conversions, new-customer revenue, content reuse value, and brand lift. Engagement alone cannot prove commercial performance.
How Are Privacy and Data Quality Changing Marketing?
First-party data gains value as privacy rules, platform restrictions, and fragmented journeys weaken tracking. Marketers need permission-based data from forms, purchases, subscriptions, product usage, service records, and conversations.
HubSpot reports that 66% of business-to-business marketers and 69% of business-to-consumer marketers consider their audience data high quality. However, almost 20% identify data-driven marketing adoption as a major challenge. Another 13% struggle to share data across their organization.
Adobe reports that 71% of organizations have shared customer data platforms, yet cross-functional AI integration remains limited. Technology access does not create usable data automatically.
You should document data sources, remove duplicate records, standardize campaign names, validate conversion events, and define metric ownership. Clean measurement creates faster decisions and safer automation.
The strongest digital marketing statistics also record uncertainty. Some sales receive influence from multiple channels. Some offline decisions remain invisible.
How Should You Apply These Digital Marketing Statistics?
Use digital marketing statistics to prioritize 3 improvements during the next 90 days. Select one acquisition problem, one conversion problem, and one retention problem.
During days 1 through 30, audit channel costs, lead quality, conversion tracking, content performance, and customer data. Remove broken tracking before comparing budgets.
During days 31 through 60, improve one high-value journey. Examples include a paid-search landing page, an organic topic cluster, an email welcome sequence, or a social retargeting path.
During days 61 through 90, scale only the change that improves a verified business metric. Keep the baseline, test period, cost, result, and next action inside one decision record.
Hoop’s proven growth case studies show how connected development, marketing, social media, and measurement support business outcomes. The examples also show why execution needs a clear commercial target.
Digital marketing statistics create value when the data changes a decision. Use benchmarks for context, then build company-specific evidence through controlled tests and consistent reporting.
Turn Marketing Data Into Measurable Growth
Digital marketing statistics show where audiences move, but your own data should decide where your budget goes. Hoop Interactive connects strategy, search, advertising, social media, content, conversion, and analytics through its digital marketing services. Request a growth audit to identify the channels, tracking gaps, and conversion opportunities that deserve attention first.
“Weak teams automate output. Strong teams automate repetitive work while retaining judgment.”
Key takeaways
- 0194% of marketers plan to use AI for content, yet only 47.18% feel confident putting it into strategy.
- 02Lead quality (39%) now outranks lead volume (29%) as the top marketing priority.
- 03Meta, Google, and Amazon are projected to hold 62.3% of global digital ad revenue in 2026.
- 04Segmented email campaigns earn 30% more opens and 50% more clicks than unsegmented sends.
Written by
Sahar
Content Writer
Frequently Asked
Questions
Everything you need to know before booking a strategy call. Can't find your answer? Contact us directly.
The most important figures track lead quality, conversion rates, returns, acquisition cost, and lifetime value. Audience and engagement provide context. Financial outcomes guide investment.
Artificial intelligence integration matters because AI affects content, advertising, reporting, search, and customer experience. Data quality and human oversight determine results.
Yes. Social advertising remains a leading brand-discovery source, especially for audiences aged 16 to 34. Strong campaigns connect reach with traffic, leads, and revenue.
Yes. Email gives you direct access to subscribers, supports segmentation, and strengthens retention. Relevant lifecycle messages outperform generic broadcast campaigns.
Review paid campaigns weekly, content monthly, and customer value quarterly. Faster reviews suit spending. Longer reviews suit compounding and retention outcomes.